HandyGraph is a useful tool that allows you to plot up to two functions or up to four tables of points simultaneously with different style and color.
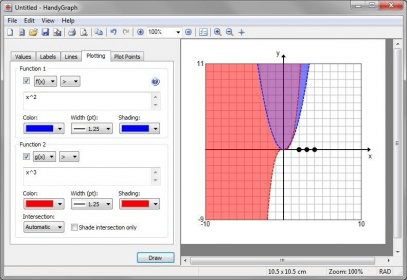
The main window of the program has two main panels, to the right you will see the graph result; to the left you will see different tabs. In the Values tab, you will be able to set the size, the minimum and maximum values of the graph, and select one of the six different graph types: linear (Cartesian), number line on the horizontal or vertical axis; logarithmic in both x and y axes; or mixed axes, one logarithmic and the other linear. In the Labels tab, you can name the axes and set the label parameters. In the Lines tab, you can format your graph, e.g., set the grid lines style, color width, etc. In the Plotting tab, you can type the function or functions to be plotted, and set the format of the function to be plotted, such as color width and shading. In the Plot Points tab, you can enter the points of each axis.
After a function or the points of a table has been entered, you just have to click the Draw to see the plotting result and you will be able to zoom, export the graph image to a file, copy/paste the graph in another document, or print the graph.

Comments